
The TRW-MN780 is the most advanced rotational rheometer for research and material development.

The TRW-MN780 platform offers an array of features including:
- Unrivaled data accuracy over
a wide range of conditions
simulating processing and
end-use conditions
- Only rheometer with true SMT technology that completely eliminates inertia, even under the most challenging conditions
- Accurate and fast-responding temperature control
- Complete data transparency and control with access to raw data that can be plotted in TRIOS or easily exported for processing in third-party software
- Future proof with fully
integrated DMA mode for
solids testing (bending,
tension, compression) and
advanced techniques such as:
-
- Arbitrary wave
- Large Amplitude Oscillatory Shear (LAOS)
- Fourier Transform (FT) Rheology Analysis
- Orthogonal Superposition (OSP) and 2 Dimensional Small Amplitude Oscillatory Shear (2D-SAOS) techniques
- Optimally windowed-chirp (OWCh)
-
and much more…
- Unrivaled data accuracy
- Unmatched strain and new stress control
- Fully integrated fast data sampling
- Separate electronics
- New Smart Swap™ environmental systems
- Patented Active Temperature Control
- Advanced accessories
- TRIOS Software providing extreme testing flexibility
- Large Amplitude Oscillatory Shear (LAOS) and Fourier Transform (FT) Rheology Analysis Software package
- NEW Orthogonal Superposition (OSP) and 2 Dimensional Small Amplitude Oscillatory Shear (2D-SAOS) techniques
- NEW DMA mode for measurements of solids in bending, tension and compression
Force/Torque Rebalance Transducer (Sample Stress)
| Transducer Type | Force/Torque Rebalance |
| Transducer Torque Motor | Brushless DC |
| Transducer Normal/Axial Motor | Brushless DC |
| Minimum Transducer Torque in Oscillation | 0.05 µN.m |
| Minimum Transducer Torque in Steady Shear | 0.1 µN.m |
| Maximum Transducer Torque | 200 mN.m |
| Transducer Torque Resolution | 1 nN.m |
| Transducer Normal/Axial Force Range | 0.001 to 20 N |
| Transducer Bearing | Groove Compensated Air |
Drive Motor (Sample Deformation)
| Maximum Motor Torque | 800 mN.m |
| Motor Design | Brushless DC |
| Motor Bearing | Jeweled Air, Sapphire |
| Displacement Control/Sensing | Optical Encoder |
| Strain Resolution | 0.04 µrad |
| Min. Angular Displacementin Oscillation | 1 µrad |
| Max. Angular Displacement in Steady Shear | Unlimited |
| Angular Velocity Range | 1 x 10⁻⁶ rad/s to 300 rad/s |
| Angular Frequency Range | 1 x 10⁻⁷ rad/s to 628 rad/s |
| Step Change in Velocity | 5 ms |
| Step Change in Strain | 10 ms |
Orthogonal Superposition and DMA modes
| Minimum Transducer Force in Oscillation | 0.001 N |
| Maximum Transducer Force | 20 N |
| Minimum Displacement in Oscillation | 0.5 µm |
| Maximum Displacement in Oscillation | 50 µm |
| Displacement Resolution | 10 nm |
| Axial Frequency range | 1 x 10⁻⁵ Hz to 16 Hz |
Stepper Motor
| Movement/Positioning | Micro-stepping Motor/Precision Lead Screw |
| Position Measurement | Linear Optical Encoder |
| Positioning Accuracy | 0.1 micron |
Temperature Systems
| Smart Swap | Standard |
| Forced Convection Oven, FCO | -150 °C to 600 °C |
| FCO Camera Viewer | Optional |
| Advanced Peltier System, APS | -10 °C to 150 °C |
| Peltier Plate | -40 °C to 180 °C |
| Sealed Bath | -10 °C to 150 °C |
Independent measurements of stress and strain
Independent measurements of stress and strain
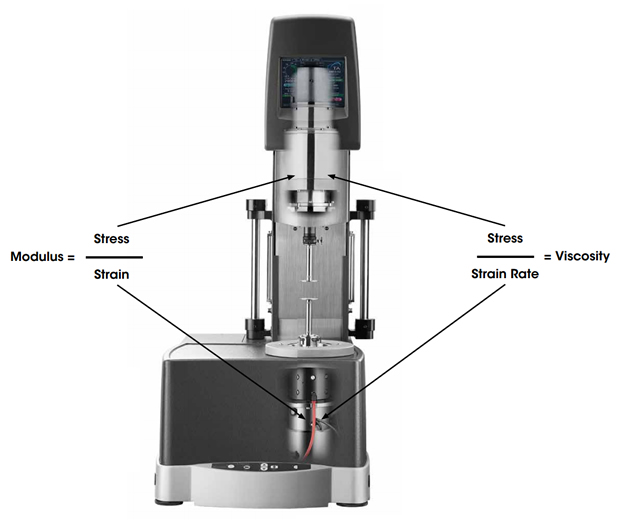
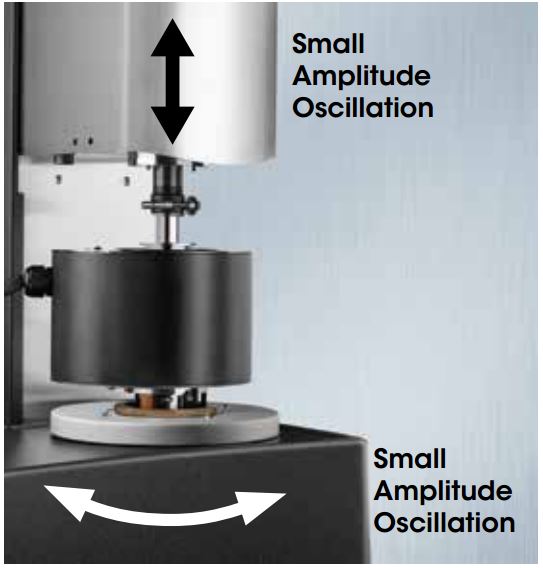
An accurate mechanical measurement is based on the fundamental assumption of a controlled variable (stimulation) and a measured variable (response). The separation of these key experimental quantities guarantees the greatest accuracy. Moreover, the analytical components dedicated to each task should be optimized to their assigned role. In the case of a modulus measurement, the application of strain and the measurement of stress should be separated, or in the case of a viscosity measurement, the application of strain rate and the measurement of stress are to be decoupled.This is the approach taken by the Taraws Instruments TRW-MN780, leading to measurements free of instrument artifacts over wide ranges of stress, strain, and frequency.
Drive Motor
Drive Motor
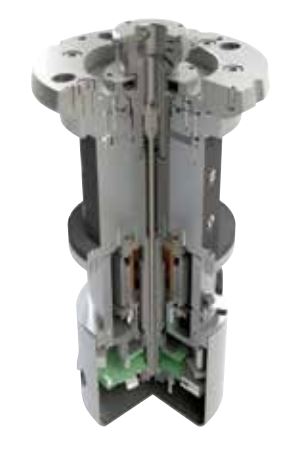 The
TRW-MN780 direct drive
motor is designed
and optimized to
deliver the most
accurate rotational
motion over wide
ranges of angular
displacement and
velocity. Key
components of the
design include a
rigid air bearing
system, an 800 mN.m
high-torque
friction-free
brushless DC motor,
patented non-contact
temperature sensing,
and an optical
encoder displacement
sensor.Designed
exclusively for
sample deformation,
the TRW-MN780 motor is
characterized by the
highest stiffness,
best concentricity,
and lowest axial
run-out, for
superior shear and
normal stress
measurements.
The
TRW-MN780 direct drive
motor is designed
and optimized to
deliver the most
accurate rotational
motion over wide
ranges of angular
displacement and
velocity. Key
components of the
design include a
rigid air bearing
system, an 800 mN.m
high-torque
friction-free
brushless DC motor,
patented non-contact
temperature sensing,
and an optical
encoder displacement
sensor.Designed
exclusively for
sample deformation,
the TRW-MN780 motor is
characterized by the
highest stiffness,
best concentricity,
and lowest axial
run-out, for
superior shear and
normal stress
measurements.
Normal Force Rebalance Transducer (FRT)
Normal Force Rebalance Transducer (FRT)
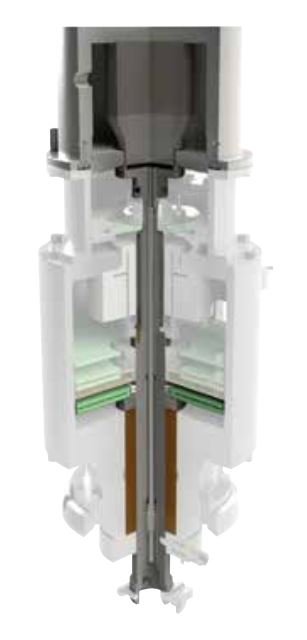 Unmatched
normal force
measurements are
achieved with the
TRW-MN780 Force
Rebalance Transducer
(FRT). It consists
of an axial servo
control system that
utilizes position
feedback to maintain
the FRT shaft in a
null position. It
delivers the most
accurate and fastest
transient normal
force measurements
with unmatched
transducer
stiffness.
Unmatched
normal force
measurements are
achieved with the
TRW-MN780 Force
Rebalance Transducer
(FRT). It consists
of an axial servo
control system that
utilizes position
feedback to maintain
the FRT shaft in a
null position. It
delivers the most
accurate and fastest
transient normal
force measurements
with unmatched
transducer
stiffness.
Torque Rebalance Transducer (TRT)
Torque Rebalance Transducer (TRT)
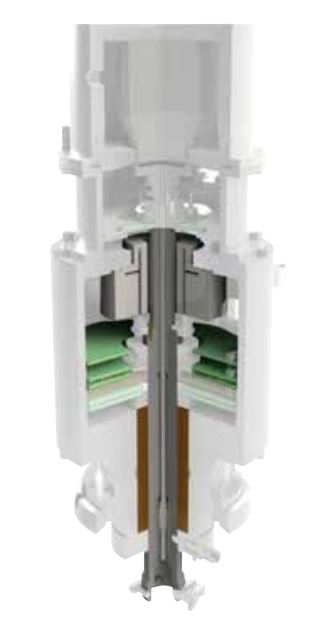 The
current required to
maintain the
transducer shaft at
null deflection
enables direct
measurements of
sample torque using
the TRW-MN780 Torque
Rebalance Transducer
(TRT). This
quasi-infinitely
stiff transducer
features a dynamic
torque range of
5,000,000 to 1, a
robust air bearing,
a high resolution
capacitive angle
sensor (Patent #
7,075,317 and
7,135,874), and new
non-contact upper
temperature sensor
(Patent #
6,931,915). The
independent and
stationary torque
measurement
eliminates the need
to correct for motor
friction and
inertia, which
translates to the
purest torque
measurement
available.
The
current required to
maintain the
transducer shaft at
null deflection
enables direct
measurements of
sample torque using
the TRW-MN780 Torque
Rebalance Transducer
(TRT). This
quasi-infinitely
stiff transducer
features a dynamic
torque range of
5,000,000 to 1, a
robust air bearing,
a high resolution
capacitive angle
sensor (Patent #
7,075,317 and
7,135,874), and new
non-contact upper
temperature sensor
(Patent #
6,931,915). The
independent and
stationary torque
measurement
eliminates the need
to correct for motor
friction and
inertia, which
translates to the
purest torque
measurement
available.
Active Temperature Control (ATC)
Active Temperature Control (ATC)
 The
TRW-MN780 incorporates
patented non-contact
temperature sensor
technology for
active measurement
and control of both
the upper and lower
plate temperature
(Patent #
6,931,915). Platinum
ResistanceThermometers
(PRTs) are directly
connected in the
motor and transducer
shafts.These PRTs
are positioned in
intimate contact
with the center of
the lower and upper
measurement
surfaces. The
temperature signal
is transmitted to
Printed Circuit
boards, from which
the temperature
reading is
transmitted through
a noncontact
(wireless) mechanism
to secondary boards
in both the motor
and transducer.
These temperature
readings enable
direct control of
both plate
temperatures and
result in more
accurate and
responsive
temperature control,
no vertical
temperature
gradients and no
need for complex
calibration
procedures and
offset tables to
infer sample
temperatures. To
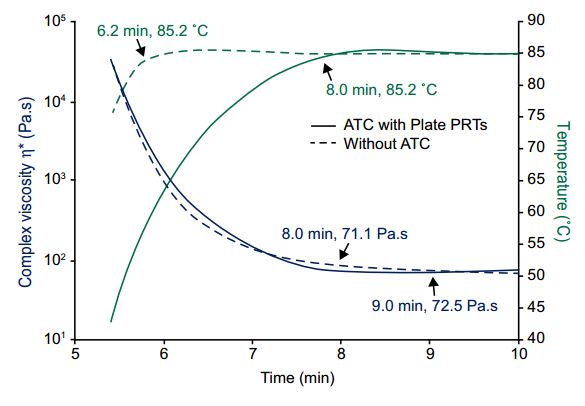
illustrate the
benefits of this
novel technology, an
asphalt sample was
held at 25 °C for
five minutes before
the temperature was
stepped to 85 °C.
The material’s
complex viscosity
was monitored in the
two successive
oscillation time
sweep tests. Two
temperature control
configurations were
used: one with the
two PRTs in physical
contact with the
plates using ATC
technology and a
second with a PRT in
close proximity to
the plates but not
physically
contacting them. The
data from the second
case show an
apparent rapid
increase in sample
temperature to 85 °C
but a slow response
from the sample’s
complex viscosity
before it reaches a
steady state value.
This shows that the
real sample
temperature is very
different from the
reported
temperature.
However, the data
from the
configuration using
the ATC technology
show the actual
plates’ temperature
rise tracking
exactly the decrease
in the material’s
complex viscosity.
Only with Active
Temperature Control
is the sample
temperature measured
so accurately.
The
TRW-MN780 incorporates
patented non-contact
temperature sensor
technology for
active measurement
and control of both
the upper and lower
plate temperature
(Patent #
6,931,915). Platinum
ResistanceThermometers
(PRTs) are directly
connected in the
motor and transducer
shafts.These PRTs
are positioned in
intimate contact
with the center of
the lower and upper
measurement
surfaces. The
temperature signal
is transmitted to
Printed Circuit
boards, from which
the temperature
reading is
transmitted through
a noncontact
(wireless) mechanism
to secondary boards
in both the motor
and transducer.
These temperature
readings enable
direct control of
both plate
temperatures and
result in more
accurate and
responsive
temperature control,
no vertical
temperature
gradients and no
need for complex
calibration
procedures and
offset tables to
infer sample
temperatures. To
illustrate the
benefits of this
novel technology, an
asphalt sample was
held at 25 °C for
five minutes before
the temperature was
stepped to 85 °C.
The material’s
complex viscosity
was monitored in the
two successive
oscillation time
sweep tests. Two
temperature control
configurations were
used: one with the
two PRTs in physical
contact with the
plates using ATC
technology and a
second with a PRT in
close proximity to
the plates but not
physically
contacting them. The
data from the second
case show an
apparent rapid
increase in sample
temperature to 85 °C
but a slow response
from the sample’s
complex viscosity
before it reaches a
steady state value.
This shows that the
real sample
temperature is very
different from the
reported
temperature.
However, the data
from the
configuration using
the ATC technology
show the actual
plates’ temperature
rise tracking
exactly the decrease
in the material’s
complex viscosity.
Only with Active
Temperature Control
is the sample
temperature measured
so accurately.
Touch-Screen and Keypad
Touch-Screen and Keypad
This graphical interface adds a new dimension in ease-of-use. Interactive activities such as geometry zeroing, sample loading, and setting temperature can be performed at the test station. Important instrument status and test information such as temperature, gap, force and motor position are displayed. The touch-screen also provides easy access to instrument settings and diagnostic reporting. A keypad at the base of the instrument allows for easy positioning of the measurement head
Frame, Vertical Movement and Alignment
Frame, Vertical Movement and Alignment
 The
TRW-MN780 frame and
vertical movement
assembly is built to
deliver maximum
stiffness,low axial
compliance (0.1
μm/N),and the most
accurate geometry
positioning,
concentricity, and
alignment.
The
TRW-MN780 frame and
vertical movement
assembly is built to
deliver maximum
stiffness,low axial
compliance (0.1
μm/N),and the most
accurate geometry
positioning,
concentricity, and
alignment.
The frame provides high strength, optimum damping for high frequency testing, and dimensional stability over a wide temperature range.
The transducer mount is held rigidly against the frame by two hardened steel cross roller slides. The slides deliver smooth vertical movement of the head while maintaining concentricity and parallelism. This is critical when setting a gap in parallel plates.
The transducer head is positioned vertically via a precision ground lead screw. It is attached to a micro-stepping motor by a rigid, preloaded, duplex bearing, which eliminates backlash.
A linear optical encoder is mounted directly between the stationary frame and moving bracket for precision head positioning, independent of the lead screw movement, to an accuracy of 0.1 micron.
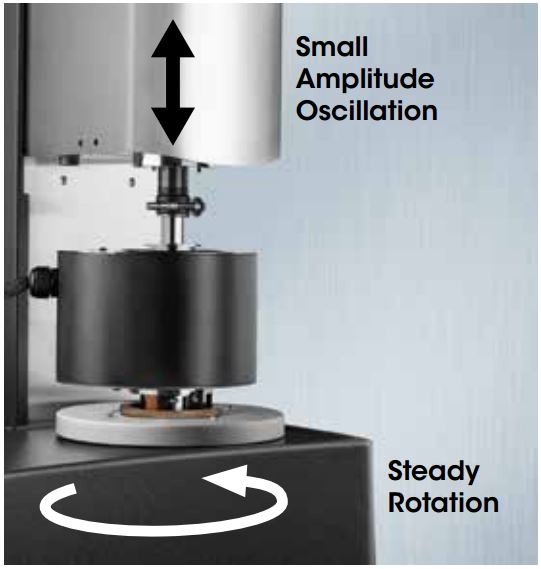
A New Dimension in Dual Head Rheological Testing
A New Dimension in Dual Head Rheological Testing
 Taraws
Instruments
introduces a new
dimension in
rheological testing
exclusive to the
TRW-MN780.
Simultaneous
deformation in the
angular and axial
directions unlocks
all new capabilities
for probing
nonlinear and
anisotropic behavior
of complex fluids.
This new testing
capability utilizes
the unique
capabilities of the
TRW-MN780 FRT to apply
oscillation in the
axial direction,
orthogonal to the
direction of angular
shear.
Taraws
Instruments
introduces a new
dimension in
rheological testing
exclusive to the
TRW-MN780.
Simultaneous
deformation in the
angular and axial
directions unlocks
all new capabilities
for probing
nonlinear and
anisotropic behavior
of complex fluids.
This new testing
capability utilizes
the unique
capabilities of the
TRW-MN780 FRT to apply
oscillation in the
axial direction,
orthogonal to the
direction of angular
shear.
Features and Benefits
- Exclusive to the TRW-MN780 rheometer
- Double gap concentric cylinder
- OSP and 2D-SAOS experiments fully programmable from TRIOS Software
- Simultaneous measurements in two directions
- Advanced Peltier System temperature control
Orthogonal Superposition (OSP)
Orthogonal Superposition (OSP)
A New Test of Non-Linear Viscoelasticity
Orthogonal Superposition provides an additional powerful method to probe non-linear viscoelasticity. Steady shearing deformation in the angular direction is coupled with an oscillatory deformation applied by the TRW-MN780 FRT in the axial direction. Steady state properties in the flow direction and dynamic properties orthogonal to flow are measured. This flow is well-controlled and the viscoelastic response is easily interpreted.
Two Dimensional Small Amplitude Oscillatory Shear (2D-SAOS)
A Selective Probe of Anisotropy
2D-SAOS measures linear viscoelasticity with directional selectivity. This is especially valuable for understanding anisotropy in complex fluids.Simultaneous oscillatory deformations in the angular and axial directions produce either linear oscillations at a controlled angle or local rotational flows, which provide a complete understanding of anisotropy in a single oscillation period.
Peltier Solvent Trap and Evaporation Blocker
Peltier Solvent Trap and Evaporation Blocker
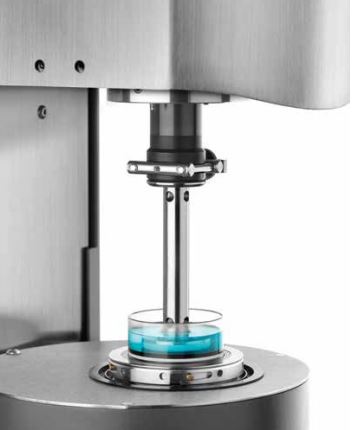
The Solvent Trap cover and Solvent Trap geometry work in concert to create a thermally stable vapor barrier, virtually eliminating solvent loss during the experiment. The geometry includes a reservoir that is filled with a very low viscosity oil or the volatile solvent present in the sample. The Solvent Trap cover includes a blade that is placed into the solvent contained in the well without touching any other part of the upper geometry. A uniform temperature, saturated vapor, environment is established, preventing loss from the sample and condensation from the cover. The Solvent Trap sits directly on a centering ring at the top of the APS surface for easy positioning.
Immersion Cup
Immersion Cup
The APS Immersion Cup allows samples to be measured while fully immersed in a fluid. It attaches easily to the top of the APS Plate with the bayonet fixture. A rubber ring provides the fluid seal and allows for easy sample loading, trimming, and subsequent sealing and filling.The Immersion Cup system can accommodate plates or cones up to 40 mm in diameter. This accessory is ideal for studying the properties of hydrogels.
Cup and Bob Geometries
Cup and Bob Geometries
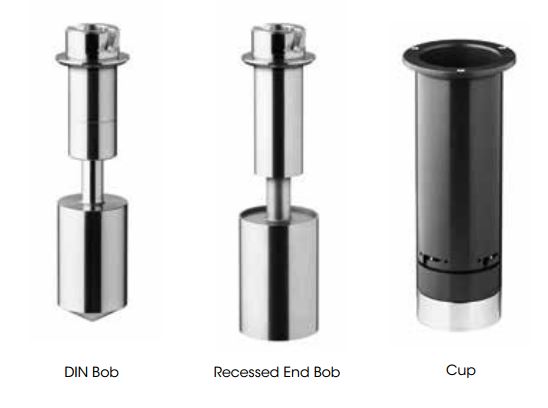
The APS geometries include cups of 10, 15 and 17 mm radius, configured with either a Recessed End or DIN Bob. The bobs have 9.3, 14 and 16 mm radii and, when used in conjunction with the corresponding cups, adhere to the DIN standards.The double gap concentric cylinder has an additional shearing surface over single gap providing lower stress and higher sensitivity for extremely low viscosity solutions.
Special Cups and Bobs
Special Cups and Bobs
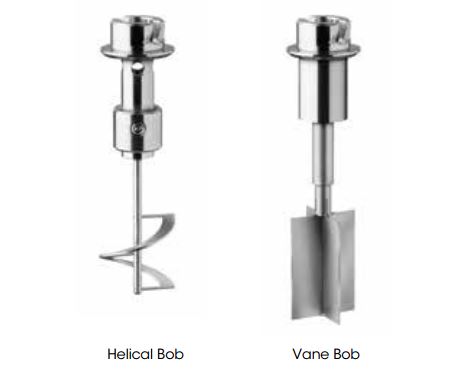
Specialty geometries include vanes and helical bobs. These special concentric cylinder geometries are very valuable for characterizing dispersions with limited stability, preventing error from slip at the material/geometry interface, and for bulk materials with larger particulates. Vane geometries are available in both 7.5 mm and 14 mm radii. The helical bob can be configured with the large cup to keep a sample mixed or particles suspended during shearing.
Oscillation Testing
Oscillation Testing
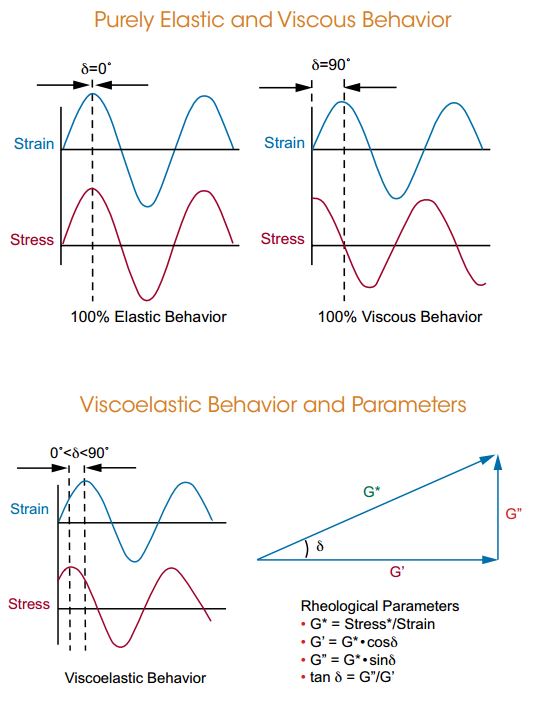
Oscillation testing is by far the most common test type for measuring viscoelastic properties of materials. Both elastic and viscous characteristics of the material can be studied by imposing a sinusoidal strain (or stress) and measuring the resultant sinusoidal stress (or strain) along with the phase difference between the two sinusoidal waves (input and output). The phase angle is zero degrees for purely elastic materials (stress and strain are in phase) and 90° for purely viscous materials (stress and strain are out of phase). Viscoelastic materials exhibit a phase angle anywhere between these two ideal cases depending on the rate of deformation. The figures to the right show these sinusoidal responses along with the variety of rheological parameters obtained. The viscoelastic parameters can be measured as a function of deformation amplitude, frequency, time, and temperature.
Oscillation Frequency Sweep
Oscillation Frequency Sweep
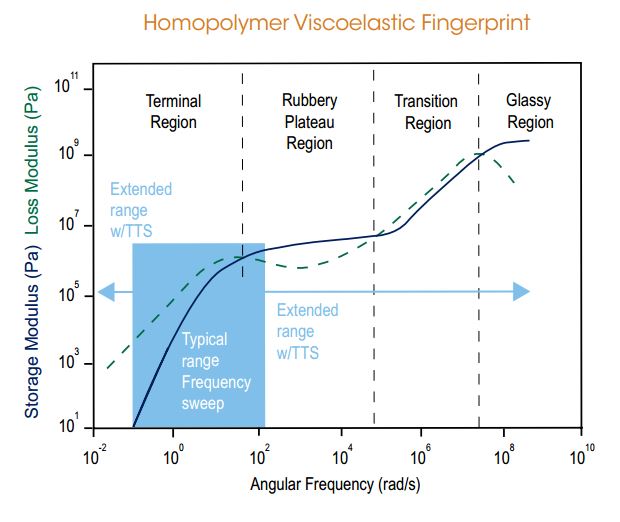
The temperature and strain are held constant in a frequency sweep and the viscoelastic properties are monitored as the frequency is varied. The figure to the right illustrates a viscoelastic fingerprint for a linear homopolymer and shows the variation of G’ and G” as a function of frequency. As frequency is the inverse of time, the curve shows the time-dependent mechanical response, with short times (high frequency) corresponding to solid-like behavior and long times (low frequency) to liquid–like behavior. The magnitude and shape of the G’ and G” curves depend on the molecular structure. Frequency sweeps are typically run over a limited range of 0.1 to 100 rad/s. Time-temperature superposition (TTS) is often used to extend the frequency range by running a series of frequency sweeps at several temperatures. The data shown comprise a master curve constructed at a reference temperature of 190 °C for polystyrene. The original frequency range of three decades was extended to about 8 decades by using TTS.
Oscillation Strain Sweep
Oscillation Strain Sweep
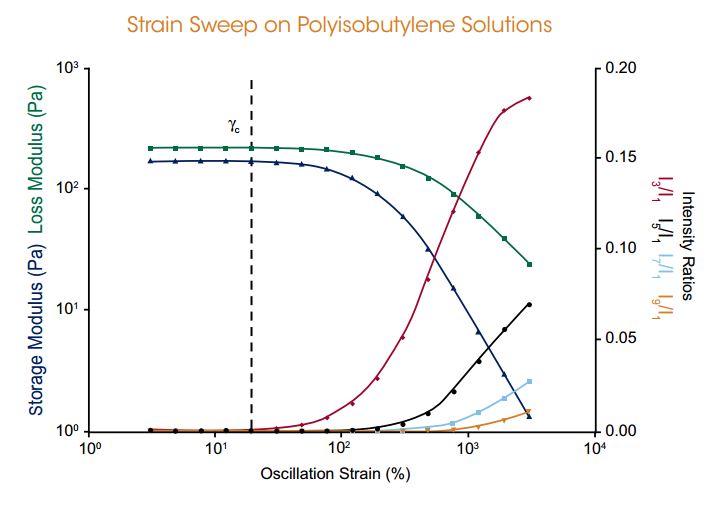
In this test, the frequency and temperature are held constant and the viscoelastic properties are monitored as the strain is varied. Strain Sweep tests are used to identify the linear viscoelastic region, LVR. Testing within the LVR provides powerful structure-property relationships as a material’s molecular arrangements are never far from equilibrium and the response is a reflection of internal dynamic processes. The data shown are for a strain sweep on polyisobultylene solution (SRM 2490) in cone and plate geometry. At low strains, within the LVR, the modulus is independent of the strain amplitude up to a critical strain γc. Beyond the critical strain the behavior is non-linear and the modulus begins to decrease in magnitude showing the end of the LVR for this material. In addition to the viscoelastic properties, the TRW-MN780 can collect higher harmonic information.
Oscillation Temperature Ramp and Sweep
Oscillation Temperature Ramp and Sweep
Measuring the viscoelastic properties over a range of temperatures is an extremely sensitive technique for measuring the α or glass transition temperature, Tg, as well as any additional β or γ transitions of a material. In a temperature ramp, a linear heating rate is applied. Typical heating rates are on the order of 1 to 5 °C/min. The material response is monitored at one or more frequencies,at constant amplitude within the LVR.Data are taken at user-defined time intervals. A temperature ramp on polycarbonate performed with the torsion rectangular geometry is shown to the right. Multiple parameters can be used to determine transitions including G’ onset point or peaks in the G” or tan δ.
In a temperature sweep a step-and-hold temperature profile is applied.At each temperature of the sweep,the sample is “soaked” or equilibrated for a user-defined amount of time to ensure temperature uniformity in the material. The material response is then measured at one or many frequencies at constant amplitude within the LVR. This is the method of choice for time-temperature superposition studies as all the frequency-dependent data are collected at the same temperature. This data can be used with the Rheology Polymer Library software for the calculation of molecular weight distribution of polymers.
Oscillation Time Sweep
Oscillation Time Sweep
While holding temperature, strain, and frequency constant, the viscoelastic properties of a material are measured as a function of time. Oscillation time sweeps are important for tracking how material structure changes with time. This is used for monitoring a curing reaction, fatigue studies, structure rebuild, and other time-dependent investigations. Data are shown for a two-part 5-minute epoxy cured using disposable parallel plate geometry.At short times the storage modulus is lower than the loss modulus. As the curing reaction progresses, the two moduli cross at the gel point, beyond which G’ becomes larger than G” and the material hardens.
Flow Testing
Flow Testing
 Flow
tests are used to
measure a material’s
“resistance to flow”
or viscosity
profiles. It is
important to note
that most materials
are non-Newtonian,
i.e. their viscosity
depends on the rate
of deformation. For
these materials the
viscosity is not a
single point value,
but is represented
by a range of values
or a curve that can
vary many orders of
magnitude over a
wide range of shear
rates. In the Flow
mode, the rheometer
applies a wide range
of shear rate (or
stress) to the
sample in a stepped
or continuous
fashion, and the
resultant shear
stress (or rate) is
measured. The
calculated apparent
viscosity is
typically plotted as
a function of the
control variable and
this curve is
referred to as a
flow curve.
Generalized flow
curves for
dispersions and
polymers are shown
below.
Flow
tests are used to
measure a material’s
“resistance to flow”
or viscosity
profiles. It is
important to note
that most materials
are non-Newtonian,
i.e. their viscosity
depends on the rate
of deformation. For
these materials the
viscosity is not a
single point value,
but is represented
by a range of values
or a curve that can
vary many orders of
magnitude over a
wide range of shear
rates. In the Flow
mode, the rheometer
applies a wide range
of shear rate (or
stress) to the
sample in a stepped
or continuous
fashion, and the
resultant shear
stress (or rate) is
measured. The
calculated apparent
viscosity is
typically plotted as
a function of the
control variable and
this curve is
referred to as a
flow curve.
Generalized flow
curves for
dispersions and
polymers are shown
below.
Fluids
Fluids
The data generated provides information on apparent viscosity, yield stress, shear thinning, thixotropy, and correlates to real world processes. Simple techniques like spindle viscometers can only measure a point or small part of the total curve.
Polymers
Polymers
A polymer’s molecular weight greatly influences its viscosity, while its molecular weight distribution and degree of branching affect its shear rate dependence. These differences are most apparent at low shear rates not possible with melt flow index or capillary devices.The TRW-MN780 can determine molecular weight based on measurements of zero shear viscosity. Cox-Merz and TTS can be used to extend the data to higher shear rates.
Transient Testing
Transient Testing
Transient Tests, which include stress relaxation and creep recovery experiments, are named so because the deformation is applied to the sample in a step fashion. They are both highly sensitive tests for measuring viscoelastic properties of materials. The TRW-MN780 is capable of both creep and stress relaxation testing. In a creep recovery test a constant stress is applied to the sample and the resulting strain is measured over time.The stress is then removed and the recovery (recoil) strain is measured. In a stress relaxation test,an instantaneous strain is applied to the sample and held constant.The resulting stress decay is measured as a function of time yielding stress relaxation modulus G(t).
Creep and Recovery
Creep and Recovery
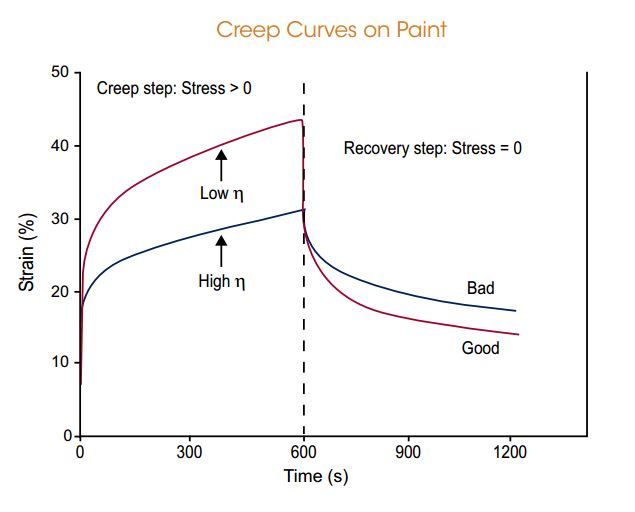
Data from creep and recovery experiments performed on paint samples that were reported to have “good” and “bad” performance are shown in the figure to the right. This testing mode is a powerful tool for measuring viscoelastic properties and understanding and predicting material performance when under loads for long periods of time.Examples include settling stability in complex fluids,and zero shear viscosity and equilibrium recoverable compliance in polymer melts.
Stress Relaxation
Stress Relaxation
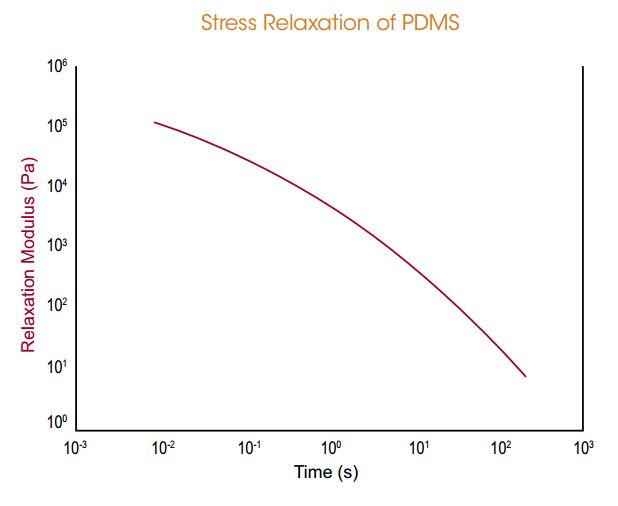
This example shows stress relaxation modulus G(t) for polydimethylsiloxane at a temperature of 25 °C. G(t) is calculated from the time-dependent stress decay divided by the applied strain. Stress relaxation experiments provide a quick and easy way to directly measure relaxation times in materials.
Multiwave Frequency Sweep
Multiwave Frequency Sweep
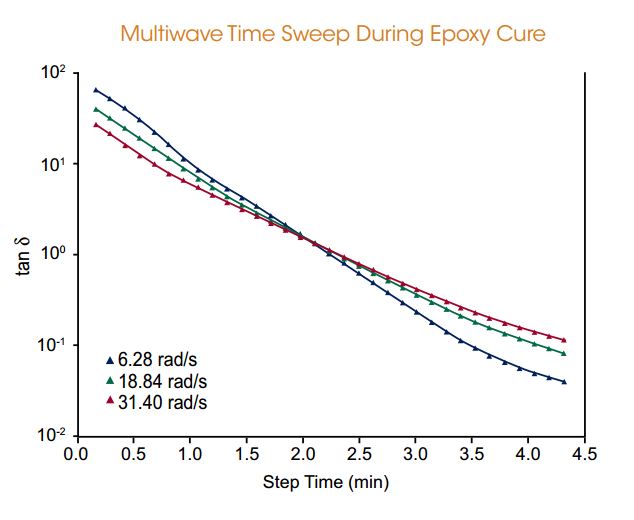
Materials with a transient structure, such as curing thermosets or polymers that thermally or oxidatively degrade, require fast testing because they are changing as the test progresses. These are expediently tested in Multiwave mode. In this mode, two or more mechanical waves can be applied to a sample at the same time independently of one another. Because the waves act independently, the total imposed strain on the sample is the sum of strains caused by all the waves. The latter is an expression of the Boltzmann Superposition Principle, which holds so long as the total applied strain is within the linear viscoelastic region (LVR). Another advantage of this test mode is the ability to provide quick results compared to the standard frequency sweep; this would make it suitable as a high throughput tool. The data in the figure to the right were obtained using the Multiwave mode to monitor the curing behavior of an epoxy. The gel point is determined by the time at which tan δ is frequency-independent. The separate motor and transducer design of the TRW-MN780 makes it uniquely well-suited to the complex strains and stresses that are created in a Multiwave experiment.
Arbitrary Waveform Mode
Arbitrary Waveform Mode
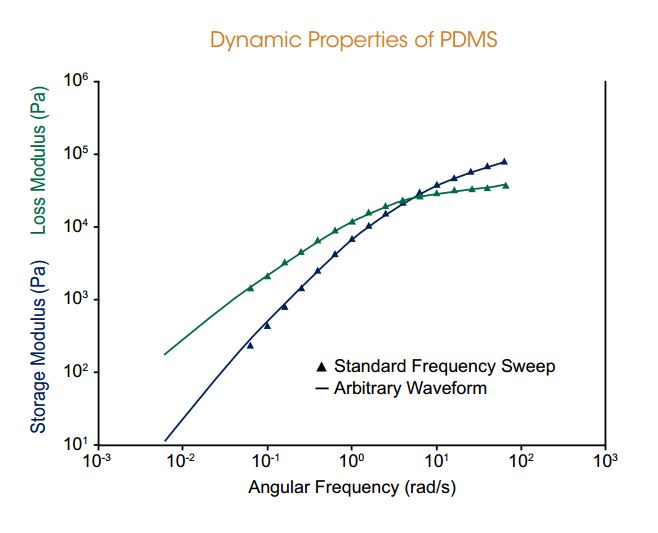
This mode is particularly advantageous for testing materials that may change rapidly with time, for modeling shear behavior in processes, for increased sensitivity in transient tests, and for research in leading edge rheological studies. Not only a standard sinusoidal deformation, but virtually any user-defined waveform expressed by a mathematical equation can be applied. The input strain and resultant stress are measured as a function of time. TRIOS software uses a Fourier transform to convert the data to the frequency domain, and these data are used to calculate any of the material’s viscoelastic properties.
In the figure to the right, the chosen input function is an “opera house” function, a sinusoidal function that continuously increases in frequency over the period of the lowest frequency. This is the fastest approach to determine the frequency spectrum in the shortest period of time. The continuous dynamic moduli calculated from the Fourier Transformation of the stress response are shown with data from a standard frequency sweep. The time needed to generate the continuous dynamic spectrum using the “opera house” function was 1000 seconds compared to 6600 seconds for a standard frequency sweep with 5 points per decade.
Large Amplitude Oscillatory Shear (LAOS)
Large Amplitude Oscillatory Shear (LAOS)
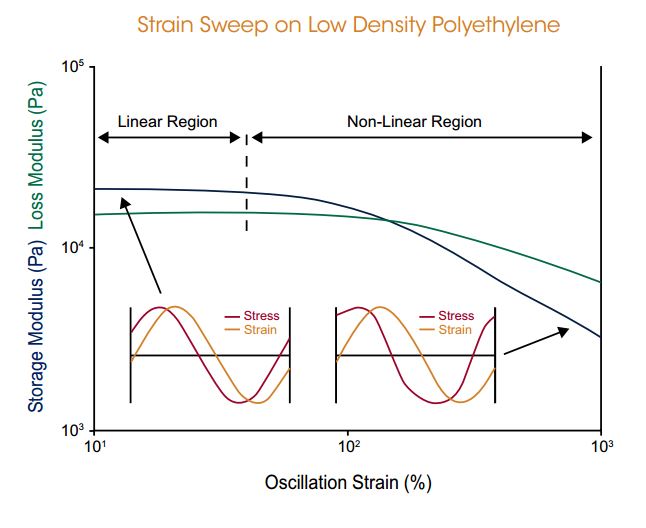
The TRW-MN780 is equipped with new high-speed electronics with digital signal processing for transient and oscillatory testing allowing simultaneous collection of angular displacement, torque and normal force in all test modes. This enables fully integrated high speed data acquisition for transient (up to 8,000 Hz) and oscillation (up to 15,000 Hz) measurements. The high sampling speed provides superior resolution of magnitude and phase of the measured signals. This allows much better higher harmonic resolution for automatic analysis during oscillation tests or post Fourier transformation analysis. Higher harmonics that occur in the stress signal in oscillation tests are a result of a non-linear response. This is illustrated for LDPE measured with the Cone and Partitioned Plate accessory in the figure to the right.High speed data acquisition is then essential to capture the true material’s stress response. This capability establishes the TRW-MN780 rheometer as the ideal platform to perform highly accurate LAOS experiments and provide the most trusted fundamental and higher order harmonic data. An optional software package is available to analyze transient oscillation data and provide all non-linear material parameters such as: G’L , G’M, h’ L , h’ M, S, T, and Q.
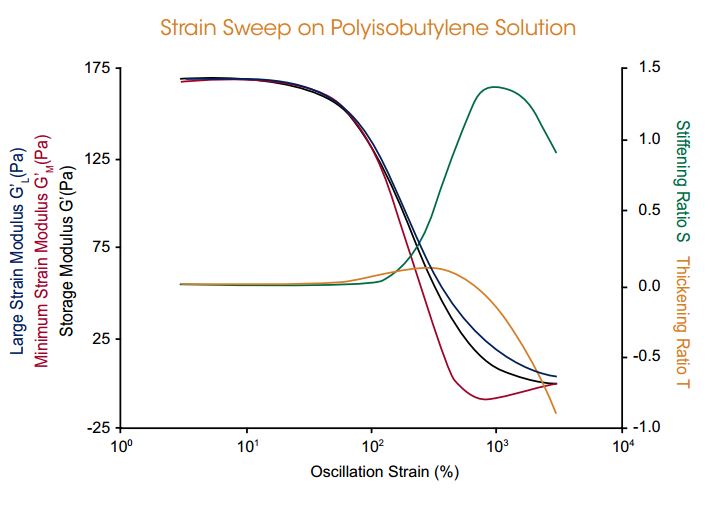
Elastic and viscous deformation mechanisms during the transition from linear to non-linear viscoelastic regions of a polyisobutylene solution (2490) were investigated. The data to the right show a monotonic decrease of the storage modulus starting at 10% amplitude along with the large and minimum strain moduli. Nonlinear parameters S (Stiffening/Softening ratio) and T (Thickening/ Thinning ratio) provide more insight into the dynamics of the nonlinear transition and structural changes. T increases at the transition onset to about a value of 0.125 then rapidly decreases as the polymer solution becomes more and more disentangled. However, S starts to increase at a higher amplitude than T then increases rapidly to reach a maximum value about 1.25 before decreasing again. As the material is strained both stiffening and thickening/ thinning mechanisms contribute to the overall structural changes, which is not captured in the elastic modulus G’ at large amplitude.
- Google Scholar Citations
- Its Not a Rheometer, Its the New TRW-MN780
- Find Out What Our Customers Are Saying
- Independent Stress & Strain Measurements
- Orthogonal Superposition: A New Dimension in Dual Head Rheological Testing
- 2 Instruments in 1: Dynamic Bending, Compression and Tension with the TRW-MN780
- Application of Rheology of Polymers
- Understanding Rheology of Thermoplastic Polymers
- Understanding Rheology of Thermosets
- Understanding Rheology of Structured Fluids
- Webinar: Orthogonal Superposition Rheology
- Webinar: Rheological Fingerprinting of Complex Fluids and Soft Solids using LAOS
- Webinar: Interfacial Rheology -G. Fuller
- Webinar: Interfacial Rheology -G. Fuller ON YouTube
- Webinar: Rheological Fingerprinting of Complex Fluids and Soft Solids using LAOS – G. McKinley
- Webinar: Analyzing Polymer Molecular Weight Distribution and Blend Morphology Using Rheology – C. Macosko
- Description
-
Rheology is the study of flow and deformation of materials under the influence of an external force or stress. The combination of stress, strain and shear behavior forms the basis of rheology, the science of the deformation of materials. Rheology measurements are used to ensure successful material processing, optimize product performance, gain insights into complex microstructures and develop novel materials.Rheometers are high-precision instruments that measure flow and deformation by applying a force to a sample and measuring the resulting stress or strain, allowing for measurement of viscosity and modulus. Rheological measurements are typically performed using a high-precision instruments known as rheometers to obtain critical material parameters such as viscosity and modulus. With a rheometer, viscosity measurements extend far beyond the limits of a traditional viscometer, characterizing non-Newtonian behaviors like shear thinning, thixotropy, and yield stress of complex fluids (emulsions, suspensions, paints, inks, coatings, slurries). Oscillatory rheology measures viscoelasticity (Storage Modulus, Loss Modulus, Tan Delta) of materials ranging from low-viscosity fluids to stiff solids in DMA mode (Dynamic Mechanical Analysis).The TRW-MN780 is a premier high-performance rheometer that provides the most accurate rheological data over a wide range of conditions. The TRW-MN780 is routinely used in leading R&D labs and manufacturing sites to relate the material chemistry to its processability and end-use properties for a wide variety of materials ranging from proteins to polymers, coatings to composites, and everything in between.Unlike competitive systems, the TRW-MN780 is the only rheometer equipped with the industry-leading separate motor and transducer technology (SMT) which eliminates any inertial contributions and provides users with unrivaled data accuracy over a wide range of test conditions. Coupled with fast-responding, uniform, accurate temperature control, the TRW-MN780 allows users to perform rheological measurements while replicating processing and end-use conditions. These measurements thus enable users to optimize the processability of new and existing materials in a time- and cost-effective manner, define robust CQAs and ensure that the finished products meet the end-use KPIs around product performance, consumer perception and storage stability. The TRW-MN780 accessories are easy to install and use, and they provide an added dimension to rheological measurements. TRW-MN780 users gain detailed insights into a material’s micro-structure and relate it to the end-use properties, helping push the boundaries of materials research and development in pure and applied sciences.
The TRW-MN780 platform offers an array of features including:
- Unrivaled data accuracy
over a wide range of
conditions simulating
processing and end-use
conditions
- Only rheometer with true SMT technology that completely eliminates inertia, even under the most challenging conditions
- Accurate and fast-responding temperature control
- Complete data transparency and control with access to raw data that can be plotted in TRIOS or easily exported for processing in third-party software
- Future proof with fully
integrated DMA mode for
solids testing (bending,
tension, compression)
and advanced techniques
such as:
-
- Arbitrary wave
- Large Amplitude Oscillatory Shear (LAOS)
- Fourier Transform (FT) Rheology Analysis
- Orthogonal Superposition (OSP) and 2 Dimensional Small Amplitude Oscillatory Shear (2D-SAOS) techniques
- Optimally windowed-chirp (OWCh)
-
and much more…
The TRW-MN780 platform offers an array of incomparable features including:- Unrivaled data accuracy
- Unmatched strain and new stress control
- Fully integrated fast data sampling
- Separate electronics
- New Smart Swap™ environmental systems
- Patented Active Temperature Control
- Advanced accessories
- TRIOS Software providing extreme testing flexibility
- Large Amplitude Oscillatory Shear (LAOS) and Fourier Transform (FT) Rheology Analysis Software package
- NEW Orthogonal Superposition (OSP) and 2 Dimensional Small Amplitude Oscillatory Shear (2D-SAOS) techniques
- NEW DMA mode for measurements of solids in bending, tension and compression
There simply is no comparison to any other rheometer - Unrivaled data accuracy
over a wide range of
conditions simulating
processing and end-use
conditions
- Specifications
-
Force/Torque Rebalance Transducer (Sample Stress)
Transducer Type Force/Torque Rebalance Transducer Torque Motor Brushless DC Transducer Normal/Axial Motor Brushless DC Minimum Transducer Torque in Oscillation 0.05 µN.m Minimum Transducer Torque in Steady Shear 0.1 µN.m Maximum Transducer Torque 200 mN.m Transducer Torque Resolution 1 nN.m Transducer Normal/Axial Force Range 0.001 to 20 N Transducer Bearing Groove Compensated Air Drive Motor (Sample Deformation)
Maximum Motor Torque 800 mN.m Motor Design Brushless DC Motor Bearing Jeweled Air, Sapphire Displacement Control/Sensing Optical Encoder Strain Resolution 0.04 µrad Min. Angular Displacementin Oscillation 1 µrad Max. Angular Displacement in Steady Shear Unlimited Angular Velocity Range 1 x 10⁻⁶ rad/s to 300 rad/s Angular Frequency Range 1 x 10⁻⁷ rad/s to 628 rad/s Step Change in Velocity 5 ms Step Change in Strain 10 ms Orthogonal Superposition and DMA modes
Minimum Transducer Force in Oscillation 0.001 N Maximum Transducer Force 20 N Minimum Displacement in Oscillation 0.5 µm Maximum Displacement in Oscillation 50 µm Displacement Resolution 10 nm Axial Frequency range 1 x 10⁻⁵ Hz to 16 Hz Stepper Motor
Movement/Positioning Micro-stepping Motor/Precision Lead Screw Position Measurement Linear Optical Encoder Positioning Accuracy 0.1 micron Temperature Systems
Smart Swap Standard Forced Convection Oven, FCO -150 °C to 600 °C FCO Camera Viewer Optional Advanced Peltier System, APS -10 °C to 150 °C Peltier Plate -40 °C to 180 °C Sealed Bath -10 °C to 150 °C - Features
-
Independent measurements of stress and strain
Independent measurements of stress and strain
An accurate mechanical measurement is based on the fundamental assumption of a controlled variable (stimulation) and a measured variable (response). The separation of these key experimental quantities guarantees the greatest accuracy. Moreover, the analytical components dedicated to each task should be optimized to their assigned role. In the case of a modulus measurement, the application of strain and the measurement of stress should be separated, or in the case of a viscosity measurement, the application of strain rate and the measurement of stress are to be decoupled.This is the approach taken by the Taraws Instruments TRW-MN780, leading to measurements free of instrument artifacts over wide ranges of stress, strain, and frequency.
Drive Motor
Drive Motor
The
TRW-MN780 direct
drive motor is
designed and
optimized to
deliver the most
accurate
rotational
motion over wide
ranges of
angular
displacement and
velocity. Key
components of
the design
include a rigid
air bearing
system, an 800
mN.m high-torque
friction-free
brushless DC
motor, patented
non-contact
temperature
sensing, and an
optical encoder
displacement
sensor.Designed
exclusively for
sample
deformation, the
TRW-MN780 motor is
characterized by
the highest
stiffness, best
concentricity,
and lowest axial
run-out, for
superior shear
and normal
stress
measurements.
Normal Force Rebalance Transducer (FRT)
Normal Force Rebalance Transducer (FRT)
Unmatched
normal force
measurements are
achieved with
the TRW-MN780
Force Rebalance
Transducer
(FRT). It
consists of an
axial servo
control system
that utilizes
position
feedback to
maintain the FRT
shaft in a null
position. It
delivers the
most accurate
and fastest
transient normal
force
measurements
with unmatched
transducer
stiffness.
Torque Rebalance Transducer (TRT)
Torque Rebalance Transducer (TRT)
The
current required
to maintain the
transducer shaft
at null
deflection
enables direct
measurements of
sample torque
using the
TRW-MN780 Torque
Rebalance
Transducer
(TRT). This
quasi-infinitely
stiff transducer
features a
dynamic torque
range of
5,000,000 to 1,
a robust air
bearing, a high
resolution
capacitive angle
sensor (Patent #
7,075,317 and
7,135,874), and
new non-contact
upper
temperature
sensor (Patent #
6,931,915). The
independent and
stationary
torque
measurement
eliminates the
need to correct
for motor
friction and
inertia, which
translates to
the purest
torque
measurement
available.
Active Temperature Control (ATC)
Active Temperature Control (ATC)
The
TRW-MN780
incorporates
patented
non-contact
temperature
sensor
technology for
active
measurement and
control of both
the upper and
lower plate
temperature
(Patent #
6,931,915).
Platinum
ResistanceThermometers
(PRTs) are
directly
connected in the
motor and
transducer
shafts.These
PRTs are
positioned in
intimate contact
with the center
of the lower and
upper
measurement
surfaces. The
temperature
signal is
transmitted to
Printed Circuit
boards, from
which the
temperature
reading is
transmitted
through a
noncontact
(wireless)
mechanism to
secondary boards
in both the
motor and
transducer.
These
temperature
readings enable
direct control
of both plate
temperatures and
result in more
accurate and
responsive
temperature
control, no
vertical
temperature
gradients and no
need for complex
calibration
procedures and
offset tables to
infer sample
temperatures. To
illustrate the
benefits of this
novel
technology, an
asphalt sample
was held at 25
°C for five
minutes before
the temperature
was stepped to
85 °C. The
material’s
complex
viscosity was
monitored in the
two successive
oscillation time
sweep tests. Two
temperature
control
configurations
were used: one
with the two
PRTs in physical
contact with the
plates using ATC
technology and a
second with a
PRT in close
proximity to the
plates but not
physically
contacting them.
The data from
the second case
show an apparent
rapid increase
in sample
temperature to
85 °C but a slow
response from
the sample’s
complex
viscosity before
it reaches a
steady state
value. This
shows that the
real sample
temperature is
very different
from the
reported
temperature.
However, the
data from the
configuration
using the ATC
technology show
the actual
plates’
temperature rise
tracking exactly
the decrease in
the material’s
complex
viscosity. Only
with Active
Temperature
Control is the
sample
temperature
measured so
accurately.
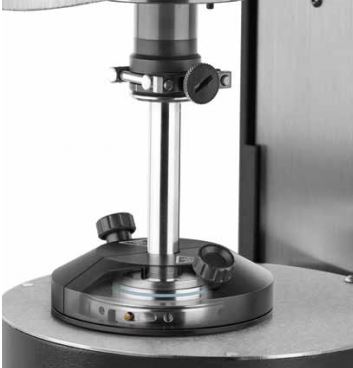
Touch-Screen and Keypad
Touch-Screen and Keypad
This graphical interface adds a new dimension in ease-of-use. Interactive activities such as geometry zeroing, sample loading, and setting temperature can be performed at the test station. Important instrument status and test information such as temperature, gap, force and motor position are displayed. The touch-screen also provides easy access to instrument settings and diagnostic reporting. A keypad at the base of the instrument allows for easy positioning of the measurement head
Frame, Vertical Movement and Alignment
Frame, Vertical Movement and Alignment
The
TRW-MN780 frame
and vertical
movement
assembly is
built to deliver
maximum
stiffness,low
axial compliance
(0.1 μm/N),and
the most
accurate
geometry
positioning,
concentricity,
and alignment.
The frame provides high strength, optimum damping for high frequency testing, and dimensional stability over a wide temperature range.
The transducer mount is held rigidly against the frame by two hardened steel cross roller slides. The slides deliver smooth vertical movement of the head while maintaining concentricity and parallelism. This is critical when setting a gap in parallel plates.
The transducer head is positioned vertically via a precision ground lead screw. It is attached to a micro-stepping motor by a rigid, preloaded, duplex bearing, which eliminates backlash.
A linear optical encoder is mounted directly between the stationary frame and moving bracket for precision head positioning, independent of the lead screw movement, to an accuracy of 0.1 micron.
A New Dimension in Dual Head Rheological Testing
A New Dimension in Dual Head Rheological Testing
Taraws
Instruments
introduces a new
dimension in
rheological
testing
exclusive to the
TRW-MN780.
Simultaneous
deformation in
the angular and
axial directions
unlocks all new
capabilities for
probing
nonlinear and
anisotropic
behavior of
complex fluids.
This new testing
capability
utilizes the
unique
capabilities of
the TRW-MN780 FRT
to apply
oscillation in
the axial
direction,
orthogonal to
the direction of
angular shear.
Features and Benefits
- Exclusive to the TRW-MN780 rheometer
- Double gap concentric cylinder
- OSP and 2D-SAOS experiments fully programmable from TRIOS Software
- Simultaneous measurements in two directions
- Advanced Peltier System temperature control
Orthogonal Superposition (OSP)
Orthogonal Superposition (OSP)
A New Test of Non-Linear Viscoelasticity
Orthogonal Superposition provides an additional powerful method to probe non-linear viscoelasticity. Steady shearing deformation in the angular direction is coupled with an oscillatory deformation applied by the TRW-MN780 FRT in the axial direction. Steady state properties in the flow direction and dynamic properties orthogonal to flow are measured. This flow is well-controlled and the viscoelastic response is easily interpreted.
Two Dimensional Small Amplitude Oscillatory Shear (2D-SAOS)
2 Dimensional Small Amplitude Oscillatory Shear (2D-SAOS)A Selective Probe of Anisotropy
2D-SAOS measures linear viscoelasticity with directional selectivity. This is especially valuable for understanding anisotropy in complex fluids.Simultaneous oscillatory deformations in the angular and axial directions produce either linear oscillations at a controlled angle or local rotational flows, which provide a complete understanding of anisotropy in a single oscillation period.
- Accessories
-
Peltier Solvent Trap and Evaporation Blocker
Peltier Solvent Trap and Evaporation Blocker
The Solvent Trap cover and Solvent Trap geometry work in concert to create a thermally stable vapor barrier, virtually eliminating solvent loss during the experiment. The geometry includes a reservoir that is filled with a very low viscosity oil or the volatile solvent present in the sample. The Solvent Trap cover includes a blade that is placed into the solvent contained in the well without touching any other part of the upper geometry. A uniform temperature, saturated vapor, environment is established, preventing loss from the sample and condensation from the cover. The Solvent Trap sits directly on a centering ring at the top of the APS surface for easy positioning.
Immersion Cup
Immersion Cup
The APS Immersion Cup allows samples to be measured while fully immersed in a fluid. It attaches easily to the top of the APS Plate with the bayonet fixture. A rubber ring provides the fluid seal and allows for easy sample loading, trimming, and subsequent sealing and filling.The Immersion Cup system can accommodate plates or cones up to 40 mm in diameter. This accessory is ideal for studying the properties of hydrogels.
Cup and Bob Geometries
Cup and Bob Geometries
The APS geometries include cups of 10, 15 and 17 mm radius, configured with either a Recessed End or DIN Bob. The bobs have 9.3, 14 and 16 mm radii and, when used in conjunction with the corresponding cups, adhere to the DIN standards.The double gap concentric cylinder has an additional shearing surface over single gap providing lower stress and higher sensitivity for extremely low viscosity solutions.
Special Cups and Bobs
Special Cups and Bobs
Specialty geometries include vanes and helical bobs. These special concentric cylinder geometries are very valuable for characterizing dispersions with limited stability, preventing error from slip at the material/geometry interface, and for bulk materials with larger particulates. Vane geometries are available in both 7.5 mm and 14 mm radii. The helical bob can be configured with the large cup to keep a sample mixed or particles suspended during shearing.
- Capabilities
-
Oscillation Testing
Oscillation Testing
Oscillation testing is by far the most common test type for measuring viscoelastic properties of materials. Both elastic and viscous characteristics of the material can be studied by imposing a sinusoidal strain (or stress) and measuring the resultant sinusoidal stress (or strain) along with the phase difference between the two sinusoidal waves (input and output). The phase angle is zero degrees for purely elastic materials (stress and strain are in phase) and 90° for purely viscous materials (stress and strain are out of phase). Viscoelastic materials exhibit a phase angle anywhere between these two ideal cases depending on the rate of deformation. The figures to the right show these sinusoidal responses along with the variety of rheological parameters obtained. The viscoelastic parameters can be measured as a function of deformation amplitude, frequency, time, and temperature.
Oscillation Frequency Sweep
Oscillation Frequency Sweep
The temperature and strain are held constant in a frequency sweep and the viscoelastic properties are monitored as the frequency is varied. The figure to the right illustrates a viscoelastic fingerprint for a linear homopolymer and shows the variation of G’ and G” as a function of frequency. As frequency is the inverse of time, the curve shows the time-dependent mechanical response, with short times (high frequency) corresponding to solid-like behavior and long times (low frequency) to liquid–like behavior. The magnitude and shape of the G’ and G” curves depend on the molecular structure. Frequency sweeps are typically run over a limited range of 0.1 to 100 rad/s. Time-temperature superposition (TTS) is often used to extend the frequency range by running a series of frequency sweeps at several temperatures. The data shown comprise a master curve constructed at a reference temperature of 190 °C for polystyrene. The original frequency range of three decades was extended to about 8 decades by using TTS.
Oscillation Strain Sweep
Oscillation Strain Sweep
In this test, the frequency and temperature are held constant and the viscoelastic properties are monitored as the strain is varied. Strain Sweep tests are used to identify the linear viscoelastic region, LVR. Testing within the LVR provides powerful structure-property relationships as a material’s molecular arrangements are never far from equilibrium and the response is a reflection of internal dynamic processes. The data shown are for a strain sweep on polyisobultylene solution (SRM 2490) in cone and plate geometry. At low strains, within the LVR, the modulus is independent of the strain amplitude up to a critical strain γc. Beyond the critical strain the behavior is non-linear and the modulus begins to decrease in magnitude showing the end of the LVR for this material. In addition to the viscoelastic properties, the TRW-MN780 can collect higher harmonic information.
Oscillation Temperature Ramp and Sweep
Oscillation Temperature Ramp and Sweep
Measuring the viscoelastic properties over a range of temperatures is an extremely sensitive technique for measuring the α or glass transition temperature, Tg, as well as any additional β or γ transitions of a material. In a temperature ramp, a linear heating rate is applied. Typical heating rates are on the order of 1 to 5 °C/min. The material response is monitored at one or more frequencies,at constant amplitude within the LVR.Data are taken at user-defined time intervals. A temperature ramp on polycarbonate performed with the torsion rectangular geometry is shown to the right. Multiple parameters can be used to determine transitions including G’ onset point or peaks in the G” or tan δ.
In a temperature sweep a step-and-hold temperature profile is applied.At each temperature of the sweep,the sample is “soaked” or equilibrated for a user-defined amount of time to ensure temperature uniformity in the material. The material response is then measured at one or many frequencies at constant amplitude within the LVR. This is the method of choice for time-temperature superposition studies as all the frequency-dependent data are collected at the same temperature. This data can be used with the Rheology Polymer Library software for the calculation of molecular weight distribution of polymers.
Oscillation Time Sweep
Oscillation Time Sweep
While holding temperature, strain, and frequency constant, the viscoelastic properties of a material are measured as a function of time. Oscillation time sweeps are important for tracking how material structure changes with time. This is used for monitoring a curing reaction, fatigue studies, structure rebuild, and other time-dependent investigations. Data are shown for a two-part 5-minute epoxy cured using disposable parallel plate geometry.At short times the storage modulus is lower than the loss modulus. As the curing reaction progresses, the two moduli cross at the gel point, beyond which G’ becomes larger than G” and the material hardens.
Flow Testing
Flow Testing
Flow
tests are used
to measure a
material’s
“resistance to
flow” or
viscosity
profiles. It is
important to
note that most
materials are
non-Newtonian,
i.e. their
viscosity
depends on the
rate of
deformation. For
these materials
the viscosity is
not a single
point value, but
is represented
by a range of
values or a
curve that can
vary many orders
of magnitude
over a wide
range of shear
rates. In the
Flow mode, the
rheometer
applies a wide
range of shear
rate (or stress)
to the sample in
a stepped or
continuous
fashion, and the
resultant shear
stress (or rate)
is measured. The
calculated
apparent
viscosity is
typically
plotted as a
function of the
control variable
and this curve
is referred to
as a flow curve.
Generalized flow
curves for
dispersions and
polymers are
shown below.
Fluids
Fluids
The data generated provides information on apparent viscosity, yield stress, shear thinning, thixotropy, and correlates to real world processes. Simple techniques like spindle viscometers can only measure a point or small part of the total curve.
Polymers
Polymers
A polymer’s molecular weight greatly influences its viscosity, while its molecular weight distribution and degree of branching affect its shear rate dependence. These differences are most apparent at low shear rates not possible with melt flow index or capillary devices.The TRW-MN780 can determine molecular weight based on measurements of zero shear viscosity. Cox-Merz and TTS can be used to extend the data to higher shear rates.
Transient Testing
Transient Testing
Transient Tests, which include stress relaxation and creep recovery experiments, are named so because the deformation is applied to the sample in a step fashion. They are both highly sensitive tests for measuring viscoelastic properties of materials. The TRW-MN780 is capable of both creep and stress relaxation testing. In a creep recovery test a constant stress is applied to the sample and the resulting strain is measured over time.The stress is then removed and the recovery (recoil) strain is measured. In a stress relaxation test,an instantaneous strain is applied to the sample and held constant.The resulting stress decay is measured as a function of time yielding stress relaxation modulus G(t).
Creep and Recovery
Creep and Recovery
Data from creep and recovery experiments performed on paint samples that were reported to have “good” and “bad” performance are shown in the figure to the right. This testing mode is a powerful tool for measuring viscoelastic properties and understanding and predicting material performance when under loads for long periods of time.Examples include settling stability in complex fluids,and zero shear viscosity and equilibrium recoverable compliance in polymer melts.
Stress Relaxation
Stress Relaxation
This example shows stress relaxation modulus G(t) for polydimethylsiloxane at a temperature of 25 °C. G(t) is calculated from the time-dependent stress decay divided by the applied strain. Stress relaxation experiments provide a quick and easy way to directly measure relaxation times in materials.
Multiwave Frequency Sweep
Multiwave Frequency Sweep
Materials with a transient structure, such as curing thermosets or polymers that thermally or oxidatively degrade, require fast testing because they are changing as the test progresses. These are expediently tested in Multiwave mode. In this mode, two or more mechanical waves can be applied to a sample at the same time independently of one another. Because the waves act independently, the total imposed strain on the sample is the sum of strains caused by all the waves. The latter is an expression of the Boltzmann Superposition Principle, which holds so long as the total applied strain is within the linear viscoelastic region (LVR). Another advantage of this test mode is the ability to provide quick results compared to the standard frequency sweep; this would make it suitable as a high throughput tool. The data in the figure to the right were obtained using the Multiwave mode to monitor the curing behavior of an epoxy. The gel point is determined by the time at which tan δ is frequency-independent. The separate motor and transducer design of the TRW-MN780 makes it uniquely well-suited to the complex strains and stresses that are created in a Multiwave experiment.
Arbitrary Waveform Mode
Arbitrary Waveform Mode
This mode is particularly advantageous for testing materials that may change rapidly with time, for modeling shear behavior in processes, for increased sensitivity in transient tests, and for research in leading edge rheological studies. Not only a standard sinusoidal deformation, but virtually any user-defined waveform expressed by a mathematical equation can be applied. The input strain and resultant stress are measured as a function of time. TRIOS software uses a Fourier transform to convert the data to the frequency domain, and these data are used to calculate any of the material’s viscoelastic properties.
In the figure to the right, the chosen input function is an “opera house” function, a sinusoidal function that continuously increases in frequency over the period of the lowest frequency. This is the fastest approach to determine the frequency spectrum in the shortest period of time. The continuous dynamic moduli calculated from the Fourier Transformation of the stress response are shown with data from a standard frequency sweep. The time needed to generate the continuous dynamic spectrum using the “opera house” function was 1000 seconds compared to 6600 seconds for a standard frequency sweep with 5 points per decade.
Large Amplitude Oscillatory Shear (LAOS)
Large Amplitude Oscillatory Shear (LAOS)
The TRW-MN780 is equipped with new high-speed electronics with digital signal processing for transient and oscillatory testing allowing simultaneous collection of angular displacement, torque and normal force in all test modes. This enables fully integrated high speed data acquisition for transient (up to 8,000 Hz) and oscillation (up to 15,000 Hz) measurements. The high sampling speed provides superior resolution of magnitude and phase of the measured signals. This allows much better higher harmonic resolution for automatic analysis during oscillation tests or post Fourier transformation analysis. Higher harmonics that occur in the stress signal in oscillation tests are a result of a non-linear response. This is illustrated for LDPE measured with the Cone and Partitioned Plate accessory in the figure to the right.High speed data acquisition is then essential to capture the true material’s stress response. This capability establishes the TRW-MN780 rheometer as the ideal platform to perform highly accurate LAOS experiments and provide the most trusted fundamental and higher order harmonic data. An optional software package is available to analyze transient oscillation data and provide all non-linear material parameters such as: G’L , G’M, h’ L , h’ M, S, T, and Q.
Elastic and viscous deformation mechanisms during the transition from linear to non-linear viscoelastic regions of a polyisobutylene solution (2490) were investigated. The data to the right show a monotonic decrease of the storage modulus starting at 10% amplitude along with the large and minimum strain moduli. Nonlinear parameters S (Stiffening/Softening ratio) and T (Thickening/ Thinning ratio) provide more insight into the dynamics of the nonlinear transition and structural changes. T increases at the transition onset to about a value of 0.125 then rapidly decreases as the polymer solution becomes more and more disentangled. However, S starts to increase at a higher amplitude than T then increases rapidly to reach a maximum value about 1.25 before decreasing again. As the material is strained both stiffening and thickening/ thinning mechanisms contribute to the overall structural changes, which is not captured in the elastic modulus G’ at large amplitude.
- Resources
-
- Google Scholar Citations
- Its Not a Rheometer, Its the New TRW-MN780
- Find Out What Our Customers Are Saying
- Independent Stress & Strain Measurements
- Orthogonal Superposition: A New Dimension in Dual Head Rheological Testing
- 2 Instruments in 1: Dynamic Bending, Compression and Tension with the TRW-MN780
- Application of Rheology of Polymers
- Understanding Rheology of Thermoplastic Polymers
- Understanding Rheology of Thermosets
- Understanding Rheology of Structured Fluids
- Webinar: Orthogonal Superposition Rheology
- Webinar: Rheological Fingerprinting of Complex Fluids and Soft Solids using LAOS
- Webinar: Interfacial Rheology -G. Fuller
- Webinar: Interfacial Rheology -G. Fuller ON YouTube
- Webinar: Rheological Fingerprinting of Complex Fluids and Soft Solids using LAOS – G. McKinley
- Webinar: Analyzing Polymer Molecular Weight Distribution and Blend Morphology Using Rheology – C. Macosko
TRW-MN780 Photo Gallery


